Campaign Stats
Navigation: Stats ➡️ Campaign Stats
The Campaign Stats Report in CPV Lab | CPV One shows aggregated campaign data for a specific time period, selected by you.
It provides a complete view of your campaign’s performance through multiple specialized reports (depeding on the campaign type used).
The Campaign Stats Report includes the following sections:
Filters and Widgets: Quickly filter by campaign and date range. View key campaign metrics through dynamic widgets that highlight performance at a glance.
Target Performance Report: Analyze performance grouped by data points like keyword, creative, page, or offer to identify high- and low-performing elements.
Ad Performance Report: See detailed performance data automatically grouped by Ads (Creatives) to understand which ad variations are converting best.
Landing Page Performance Report: Review data grouped by landing pages to measure and optimize your pre-sale pages' effectiveness.
Offer Performance Report: View and compare performance metrics across different offers used within the selected campaign.
Thank you performance report: view how the "thank you page" performance metrics look like
Overall Campaign Performance Report: Access a final overview of aggregated metrics for the entire campaign, helping you measure ROI and success at a glance.
Each section is designed to help you track, analyze, and optimize your campaigns more effectively using real-time performance data.
Stats are calculated in Real-Time using the average CPC or CPV entered on the Campaign Setup Page, and conversions are tracked using pixels, postbacks or manual SubID or IP Conversion Updates.
TIP
Stats are used to monitor Campaigns on a regular Basis and then Reports are used to put together the “Hard” data to get Exact Spending and Profit metrics to Optimize the Campaign further and more in-depth.
A. Performance Reports
Filters and Widgets
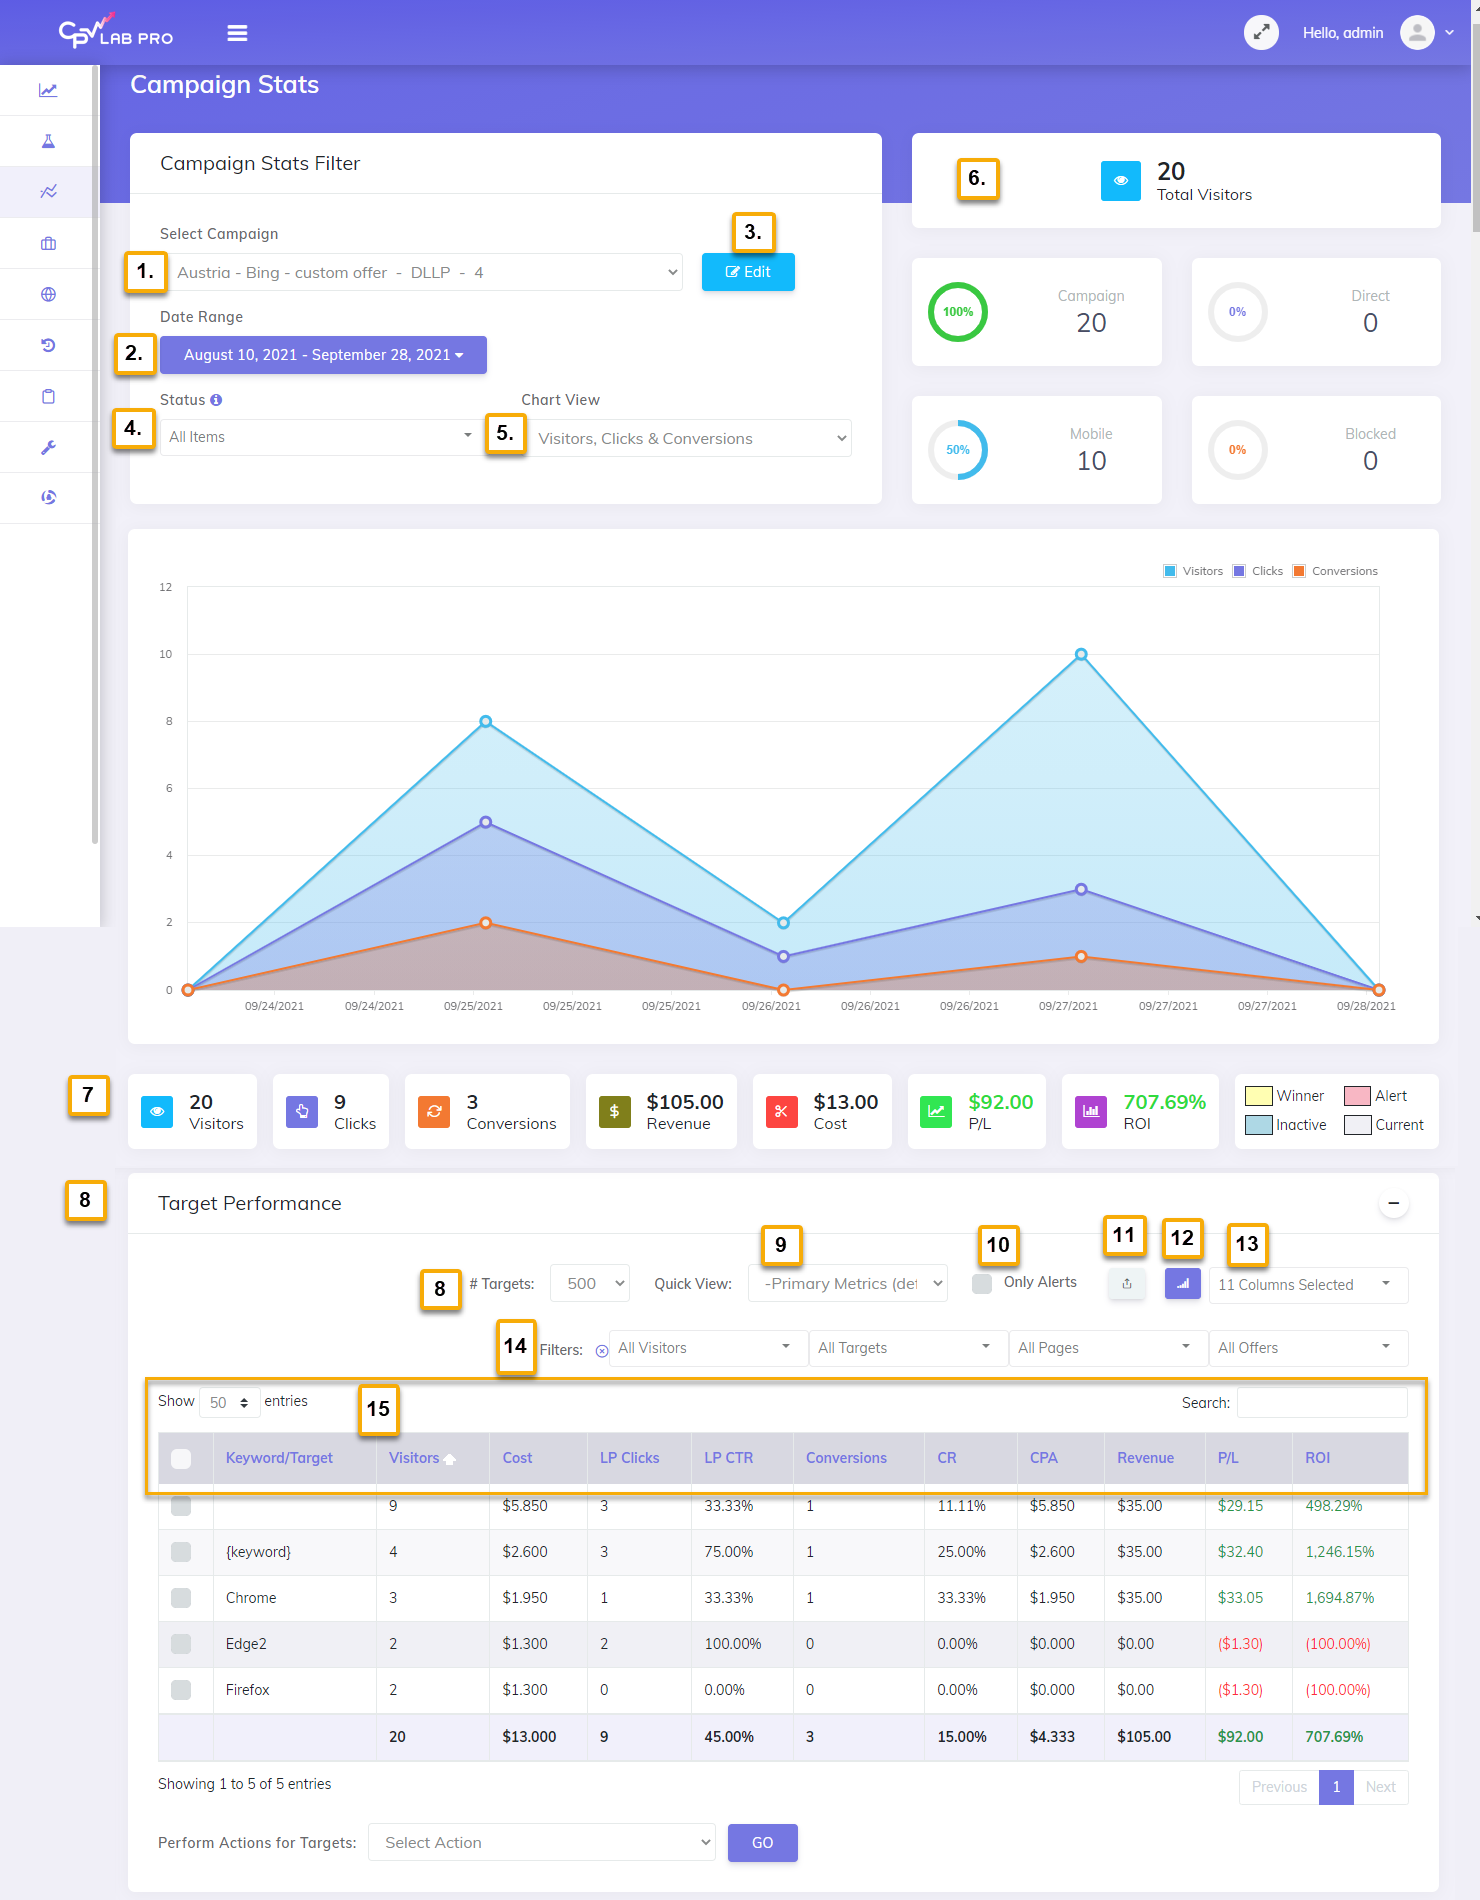
1. Campaign
- Choose the campaign you want to view stats for. All data displayed will be based on the selected campaign.
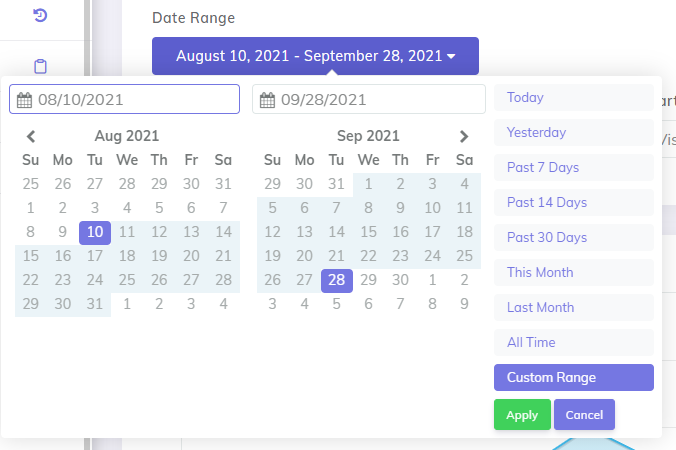
2. Date Range / Preset Date Ranges
- Enter a custom date range or select a preset time interval (such as Today, Last 7 Days, Last 30 Days) to filter your campaign data easily.
3. Edit Campaign
- Quickly jump to the Edit Campaign page for the selected campaign if you need to adjust settings, offers, or landing pages
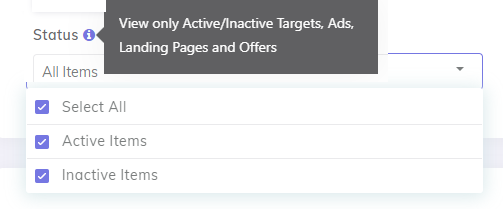
4. Status
- Choose whether to display only Active or Inactive Landing Pages (LPs) and Offers.
- You can control LP and Offer status for this campaign in the Campaign Setup Page.
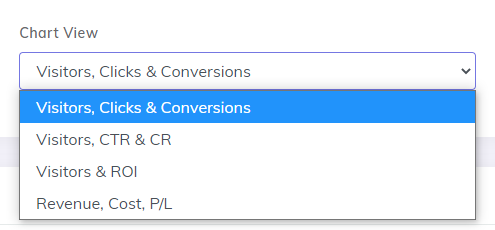
5. Chart View
- Select your preferred Chart View to better visualize your campaign data and trends.
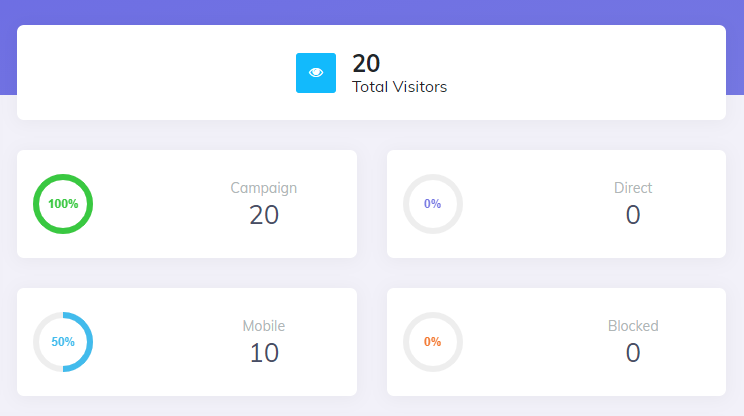
6. Visitor Breakout Stats
- A quick summary of your Visitors, based on the selected date range and the total percentage of all traffic for each Type of Visitor.
- Total Visitors - The Total Visitors the campaign has received for the selected date range.
- Campaign - Number of Visitors who arrived through your Campaign URL.
- Direct - Number of Visitors who arrived on Pages directly.
- Mobile - Number of Visitors using Mobile Devices such as smartphones or tablets.
- Blocked - Number of Blocked Visitors based on Active Blocked Traffic Rules.
7. Campaign Stats-bar
- Displays click and revenue metrics based on the selected campaign and date range, providing a quick overview of campaign performance.

Target Performance Report
The Target Performance Report in CPV Lab | CPV One allows you to analyze detailed metrics for your campaign by target, keyword, landing page, or offer.
Below are the available tools and features inside the Target Performance section:

1. #Targets
- Set a limit for the number of targets and keywords displayed in the Target Performance report to focus on your key data points.
2. Quick-View
- Select a Quick-Stats View from this dropdown menu to quickly jump between any performance reports.
3. Only Alerts
- Enable this option to display only targets or keywords that triggered alerts, based on the Alerts Profile assigned to the campaign.
4. Export CSV
- Export the currently visible stats to a CSV file for further analysis.
- Each Stats section on the Campaign Stats page includes its own Export to CSV button.
5. View Additional Stats Charts
- View multiple charts based on your selected data.
- Quickly identify your top-performing keywords, landing pages, and offers through visual insights available for each stats section.
6. Data Options
- Choose from over 30 different data points to customize the Incoming Visitor Stats and display the metrics most relevant to your campaign goals.
7. Filters
- Drill down into your campaign data by selecting single or multiple Keywords/Targets, Landing Pages, or Offers.
- Perfect for refining your analysis at a granular level.
8. Performance Stats and Columns
- Drag-and-drop columns to reorder the stats layout according to your preference.
- Click any column title to sort the data by that metric.
Video Tutorial how to customize Campaign Stats in CPV Lab | CPV One (opens new window)
TIP
For each campaign type you'll have multiple performance reports, depending on the campaign type to filter and display data for all primary elements of your campaign: Targets/Keywords, Ads, Landing Pages and Offers.
Each section has options available to Export to CSV, View Charts and Select Data Options to View.
Below are listed some other performance reports.
Ad Performance Report
The Ad Performance Report is one of the Stats performance reports for the selected campaign.
In this report you will get the data filtered by ad/creative and see how your ads are performing.

- you can choose the metrics you want to see in the report
- you can group the data by the ad tokens (ad id, placement)
Landing Page Performance Report
- The Landing Page Performance Report in CPV Lab | CPV One displays your campaign’s performance metrics grouped by landing page.
- This report helps you quickly identify which landing pages are driving the best results, and how they interact with your offers.
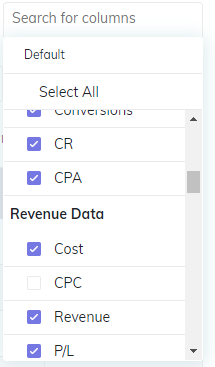
- You can group the data based on the "Campaign Data" from the Columns filter.
For example:
- Group data by Landing Page only to see the metrics (clicks, conversions, EPC, ROI) for each individual page.
- Group data by Landing Page + Offer to analyze the combined performance of landing pages with their associated offers — giving you deeper insights into what page-offer combinations are most effective.
(Example shown in the image below.)

Offer Performance Report
Similar to the Landing Page Performance report, this one will show metrics by offer.

Campaign Performance Report
Here is an overview of the entire campaign performance.

B. Marking Keywords, Ads, Pages, and Offers as Active or Inactive
- In the Campaign Stats report, you can mark Keywords/Targets, Ads, Landing Pages, and Offers as either
ActiveorInactivedirectly from the stats tables. - Inactive items will be visually highlighted in light blue, making them easy to identify at a glance.
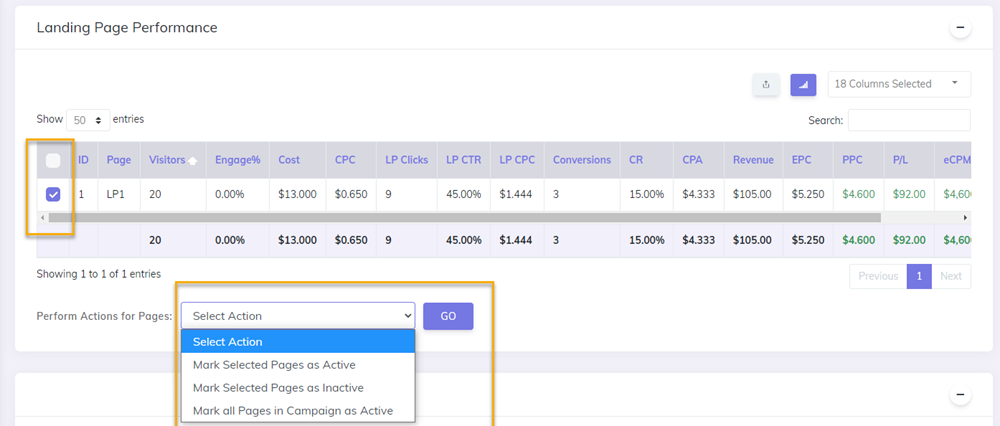
How to mark elements as Active or Inactive:
- Each row in the stats tables begins with a checkbox.
- Select the checkboxes for the Keywords, Targets, Ads, Pages, or Offers you want to update.
- Use the bulk action dropdown located just below the corresponding table.
- Choose whether to mark the selected items as Active or Inactive, then click Go.
Example 1:
- To mark specific landing pages as active or inactive, go to the Landing Page Performance Report*, select the pages, and use the dropdown to update their status.
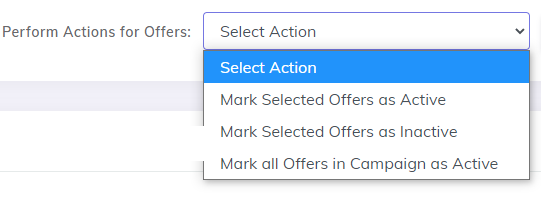
Example 2:
- Mark Offers as Active/Inactive in the Offers Performance Report
C. Right-Click Contextual Menu for Quick Navigation
- Each data table in the Campaign Stats section includes a right-click contextual menu for fast access to commonly used actions.
- This feature is designed to help you navigate to key pages without interrupting your workflow.
Where the Contextual Menu is Available
- The menu is available by right-clicking on the following columns:
- Campaign Name
- Keyword / Target
- Page
- Offer
- Date / Time
- IP Address
- Country
- State
- City
Example:
- The following is a contextual menu for the Keyword/Target column in Stats:
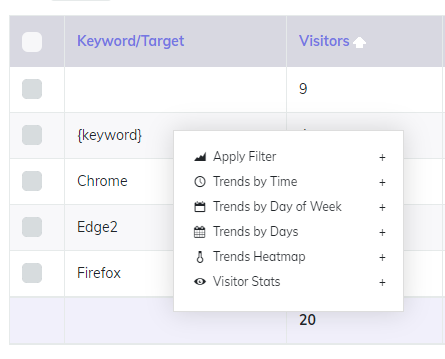
How to Use the Contextual Menu
Each menu item can open the corresponding page in 2 ways:
- Click the menu item text to open the linked page in the same browser tab
- Click the “+” icon to open the page in a new browser tab
D. Data Points
Within each Performance Section of the Campaign Stats, you’ll have multiple data points available to view depending on the Section.
Simply Check the Data Points to View and you can then Drag-and-Drop all columns to organize the information however you wish.
List of All Available Data Points and the Details for each:
Campaign Data
| Data Point | Details |
|---|---|
| ID | Campaign, Page or Offer ID |
| Page | Page Name |
| Page URL | URL of Page |
| Keyword/Target | Keyword or Target Passed from the Traffic Source |
| Ad/Creative | Ad Name or ID Passed from the Traffic Source or Manually entered |
| Extra 1 - Extra 15 | Information form Traffic Source captured in the extra token fields defined on the campaign setup page |
| Offer | Offer Name |
| Offer URL | URL of Offer |
Clicks and Conversions
| Data Point | Details |
|---|---|
| Views /Visitors | Number of Views or Visitors |
| Clicks /LP Clicks | Total Clicks / Clicks from Landing Page |
| CTR /LP CTR | Click Through Rate |
| CPC /LP CPC | Cost Per Click / Cost Per Click from Landing Page |
| Engage% | % of Visitors who reached your set Engagement Rate |
| Conversions | Number of Conversions / Sales |
| CR | Conversion Rate |
| CPA | Cost Per Action, also referred to as Cost Per |
| Subscribers | Total Opt-Ins or Leads |
| SR | Subscriber Rate % |
| CPSUB | Cost Per Subscriber |
Revenue Data
| Data Point | Details |
|---|---|
| Cost | Total Cost or Ad Spend |
| CPV /CPC | Cost Per View / Click |
| Revenue | Total Revenue |
| P/L | Profit / Loss |
| EPV /EPC | Earnings Per View / Click |
| PPV /PPC | Profit Per View / Click |
| eCPM | Earnings Per 1000 Impressions |
| ROI | Return on Investment |
| AOV | Average Order Value = Revenue / Conversions |
Referrers
| Data Point | Details |
|---|---|
| Referrer-Domain | The referring domain of the visitor |
| Referrer-Page | The referring page of the visitor |
| Category | Referrer Category |
Time & Day
| Data Point | Details |
|---|---|
| Day | Day of the Click or Conversion |
| Hour | Time of the Click or Conversion |
Mobile Browser
| Data Point | Details |
|---|---|
| Browser | Device Browser |
| Browser Version | Device Browser Version |
| Browser Language Header | The preferred language passed by visitors’ browsers |
| Cookie Support | Does the Browser Support Cookies |
| 3rd Party Cookies | Does the Browser Support 3rd Party Cookies (such as Retargeting Cookies) |
| Embedded Video | Does the Browser Support Embedded Video Playback |
| IFrames Support | Does the Browser Support iFrames |
| Javascript Support | Does the Browser Support Javascript |
Content Support
| Data Point | Details |
|---|---|
| Click to Call | Does the Device Support Click to Call |
| Flash Support | Is Flash Supported on the Device |
| FLV Playback | Does the Device Support FLV Video Playback |
| MOV Playback | Does the Device Support MOV Video Playback |
| MP4 Playback | Does the Device Support MP4 Video Playback |
| PDF Support | Does the Device have Native PDF Support |
| Receive MMS | Can the Device Receive MMS Messages |
| Receive PUSH | Can the Device Receive PUSH Messages |
| Receive SMS | Can the Device Receive SMS Messages |
| RSS Reader | Does the Device have a Native RSS Reader |
Device Info
| Data Point | Details |
|---|---|
| Brand Device | Brand (ex. Samsung, Apple) |
| Data Rate | Device Data Rate Speed |
| Device Model | Device Model Number (ex. GT-I9100 or XT984) |
| Device Name | Name of the Device (ex. Galaxy S) |
| Device Type | The Type of Device…Computer, Phone, Tablet, SmartTV |
| ISP/Carrier | The Internet Service Provider or Mobile Carrier (ex. Tmobile, Verizon) |
| Market Name | The Commonly Used Name of the Device (ex. Galaxy S III) |
| OS Device | Operating System |
| OS Version | Device Operating System Version |
| Screen Resolution | Device Screen Resolution |
| Screen Size | Device Screen Size |
| Wifi Support | Does the Device Support Wifi |
Device Usage
| Data Point | Details |
|---|---|
| Dual Orientation | Can the Display be switched from vertical to horizontal |
| Phone # Support | Does the Device Support a Phone Number and Calls |
| Pointing Method | Type of Pointing Method the Device uses, such as Touch, Clickwheel, etc. |
| QWERTY Keyboard | Does the Device have a QWERTY Keyboard |
Find more details in the video below:
Video Tutorial explaining Campaign Stats in CPV Lab (opens new window)
Other Stats you may also find useful: